
It’s easy to look at a green portfolio at the end of a green week and feel like a genius. But ask yourself this crucial question: Are you actually beating the market, or is the market simply lifting you up?
The Illusion of the Green Portfolio
Many investors suffer from an indexing illusion. If your portfolio grows by 10% in a year, you feel successful. However, if a simple, low-cost S&P 500 index fund rose 15% during that same period, your stock-picking efforts actually cost you money and time. You took on higher risk, spent hours researching individual tickers, and underperformed a stress-free passive index.
Why Traditional Brokerage Apps Fail at Benchmarking
Most popular investment apps show your absolute gains, but they fail to give you a true benchmark. To know if you are beating an ETF, you can't just look at the ETF's annual return. You have to answer the question: "What would have happened if I had invested the exact same amount of cash, on the exact same days, into the index fund instead?"
Introducing the Benchmarking Studio on MyInvestingLab
To solve this benchmarking problem, we built the Benchmarking Studio on MyInvestingLab. This simulator takes your entire historical trade data (your exact deposits, buys, and sells) and simulates a parallel universe where every single cash flow was instead directed into benchmark assets like:
- VUSA.L (Vanguard S&P 500 UCITS ETF)
- EQQQ.L (Invesco Nasdaq 100 UCITS ETF)
- VNQ (Vanguard Real Estate ETF)
This comparison gives you a true, currency-adjusted, time-weighted comparison of your stock-picking performance versus the market.
"The Benchmarking Studio simulates performance by investing the exact cash value of your buys and sells into the selected asset on the same days."
A Real Case Study: Stock Picking vs. Passive Indexing
Let's look at a concrete portfolio comparison on MyInvestingLab:
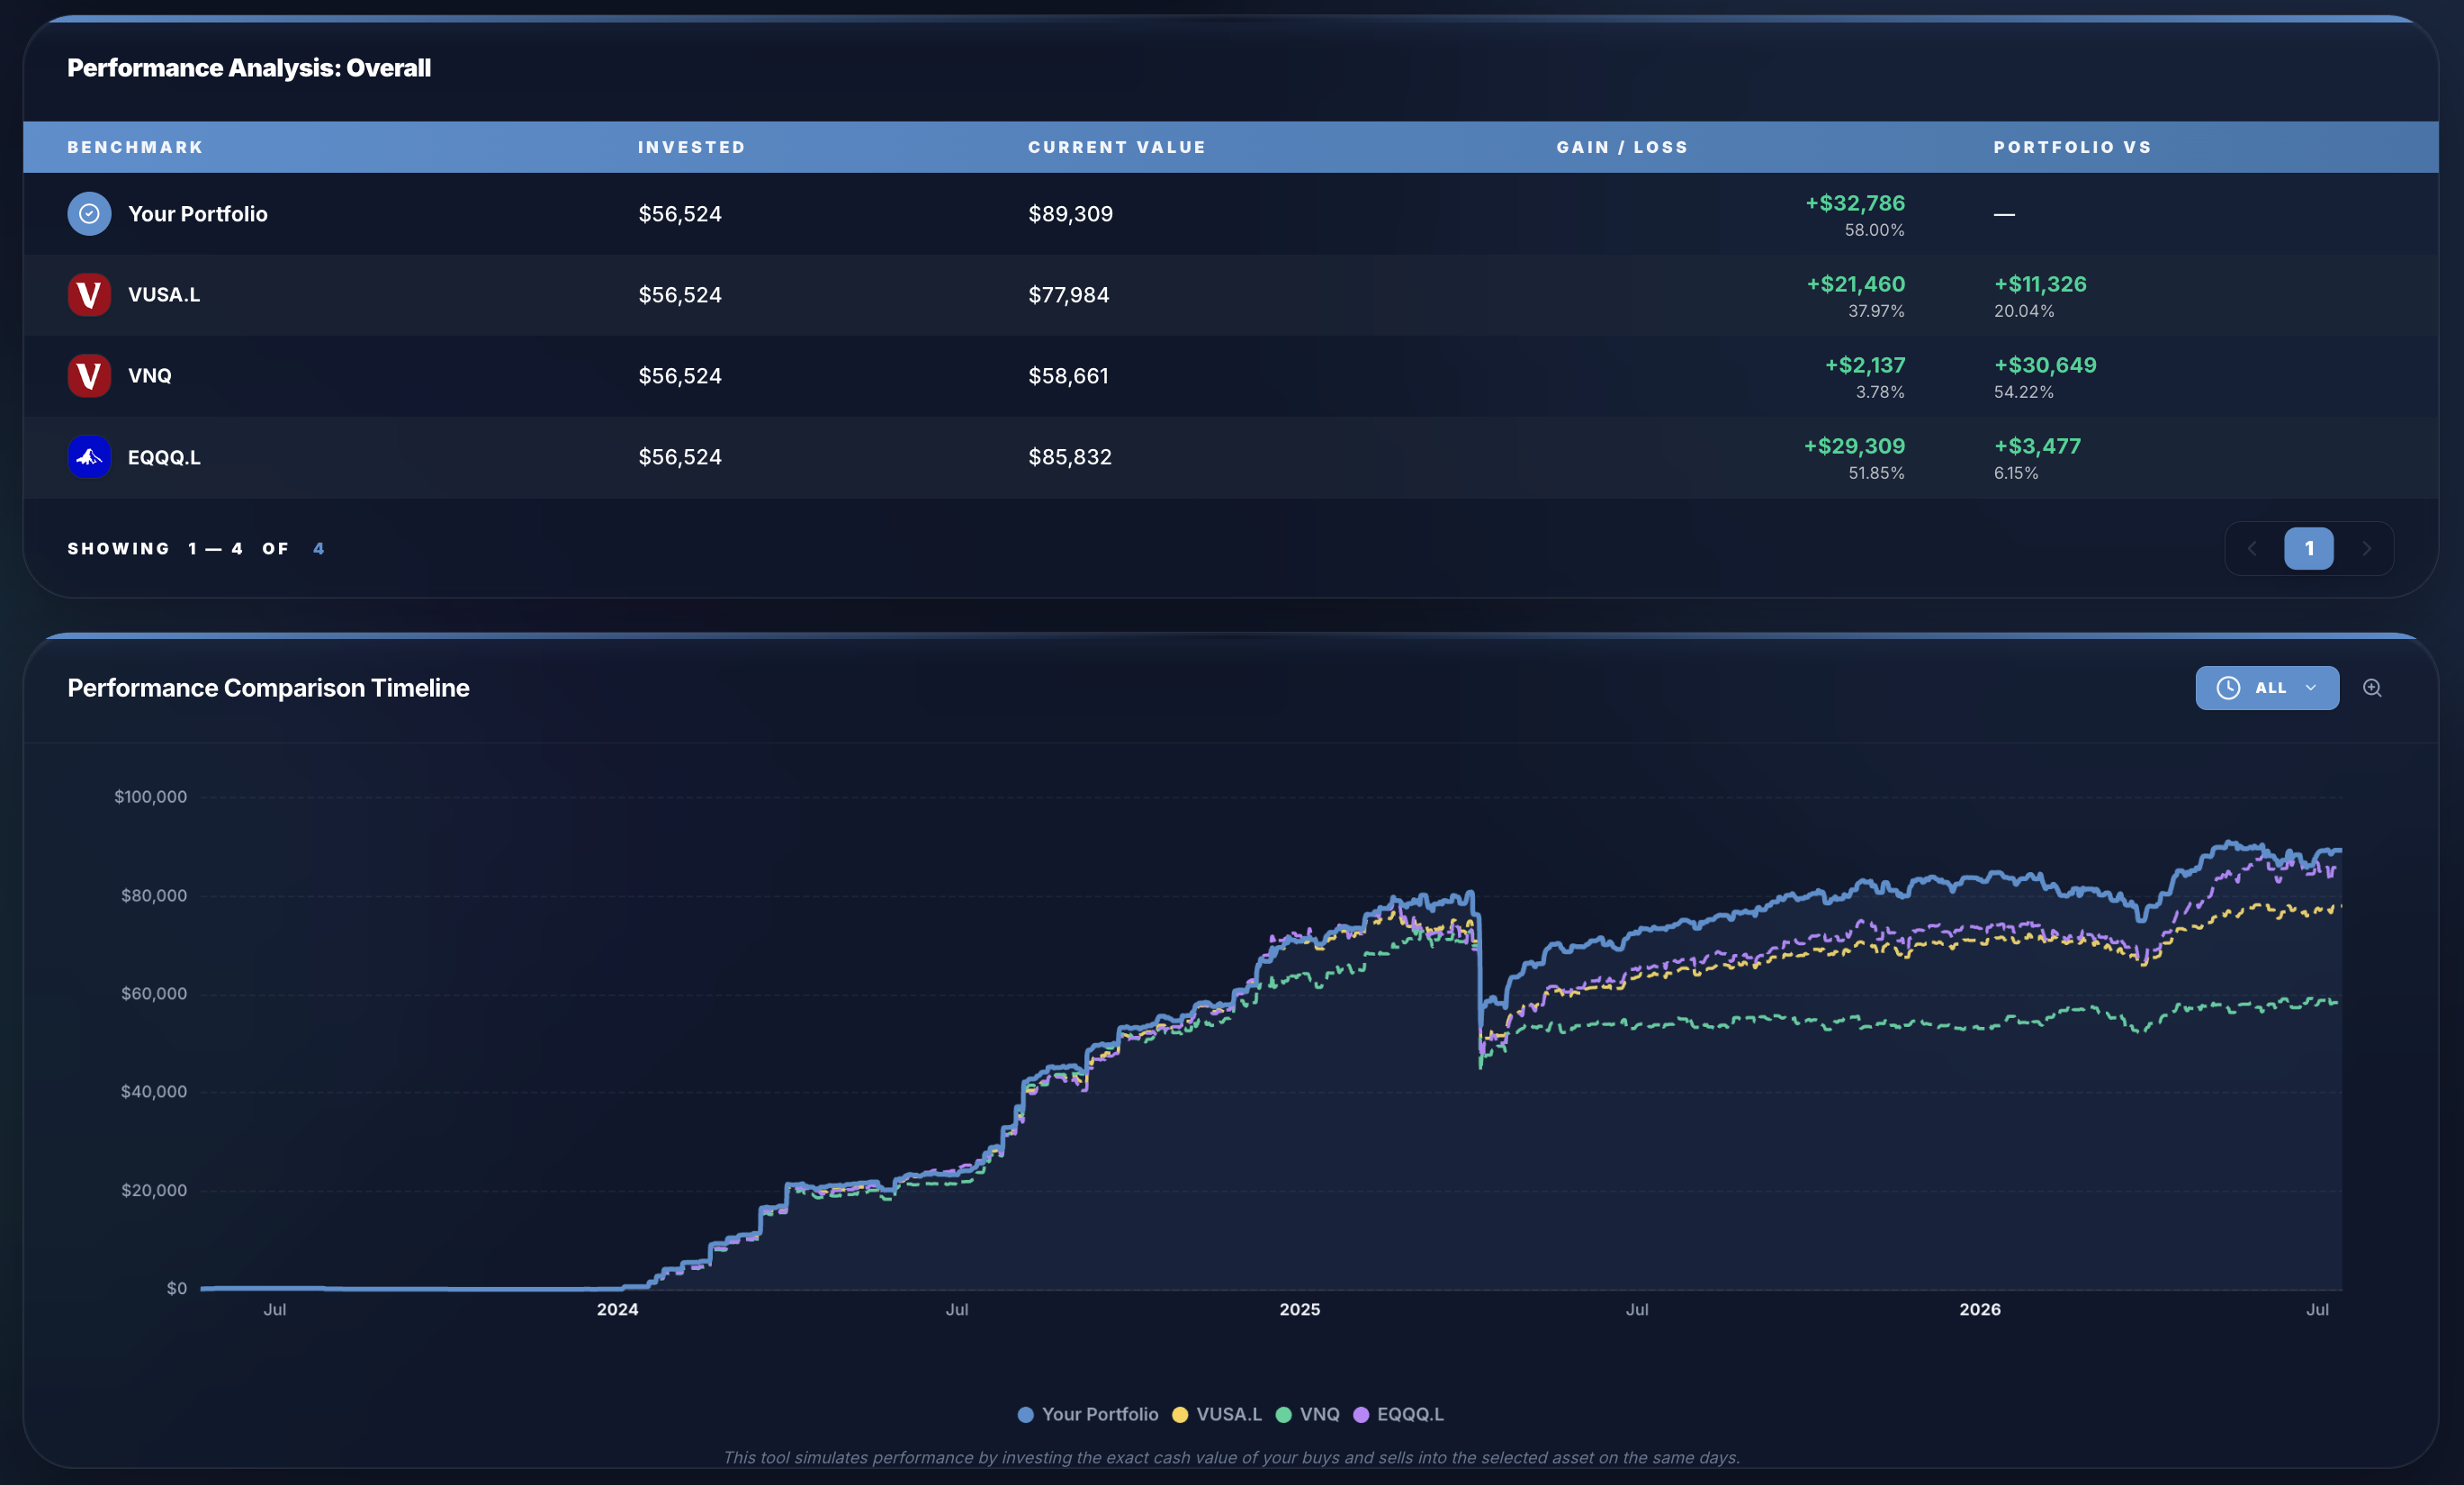
- Your Stock Portfolio: Up 58.00%
- VUSA.L (S&P 500 Index): Up 37.97%
- EQQQ.L (Nasdaq 100 Tech Index): Up 51.85%
- VNQ (US Real Estate Index): Up 3.78%
In this case, stock-picking paid off massively! By picking individual equities, this portfolio beat the standard S&P 500 by 20.03% and even outperformed the high-flying Nasdaq 100 by over 6%. Conversely, investing in real estate via VNQ would have underperformed the portfolio by a staggering 54.22%.
Sometimes Stock Picking Wins, Sometimes it Fails
This case study shows that active stock picking can deliver significant alpha. However, this is not always the case. Over a 10-year horizon, academic studies show that over 85% of active retail traders fail to beat the index. Having access to precise, automated benchmarking tools is the only way to ensure your time and effort are actually yielding returns.
How to Benchmark Your Portfolio
- Log in to your MyInvestingLab dashboard.
- Navigate to the Global Performance Comparison (Benchmarking Studio) tab.
- Select your target ETFs or stocks in the Search Bar.
- Analyze the chart timeline and check your performance difference in the metrics table.
Stop guessing if your trades are beating the market. Benchmark your history today on MyInvestingLab and make data-driven decisions about your investment strategy.